Well done!
You have completed Learning with Coda!
You have completed Learning with Coda!
When you have a lot of information, it's helpful to organize it into groups, so it's easier to view. In this video, you'll create a 'card' view of your Learning Plan and group the cards by Status.
Coda Formula Snippets
This formula pulls information from the "Learning Plan" table, filtering out only those rows where "Status" equals "In Progress" and outputs a count of the number of instances:
Learning Plan.Filter(Status="In Progress").Count()
This formula does the same for rows where "Status" equals "Not Started":
Learning Plan.Filter(Status="Not Started").Count()
Sorting Coda Tables
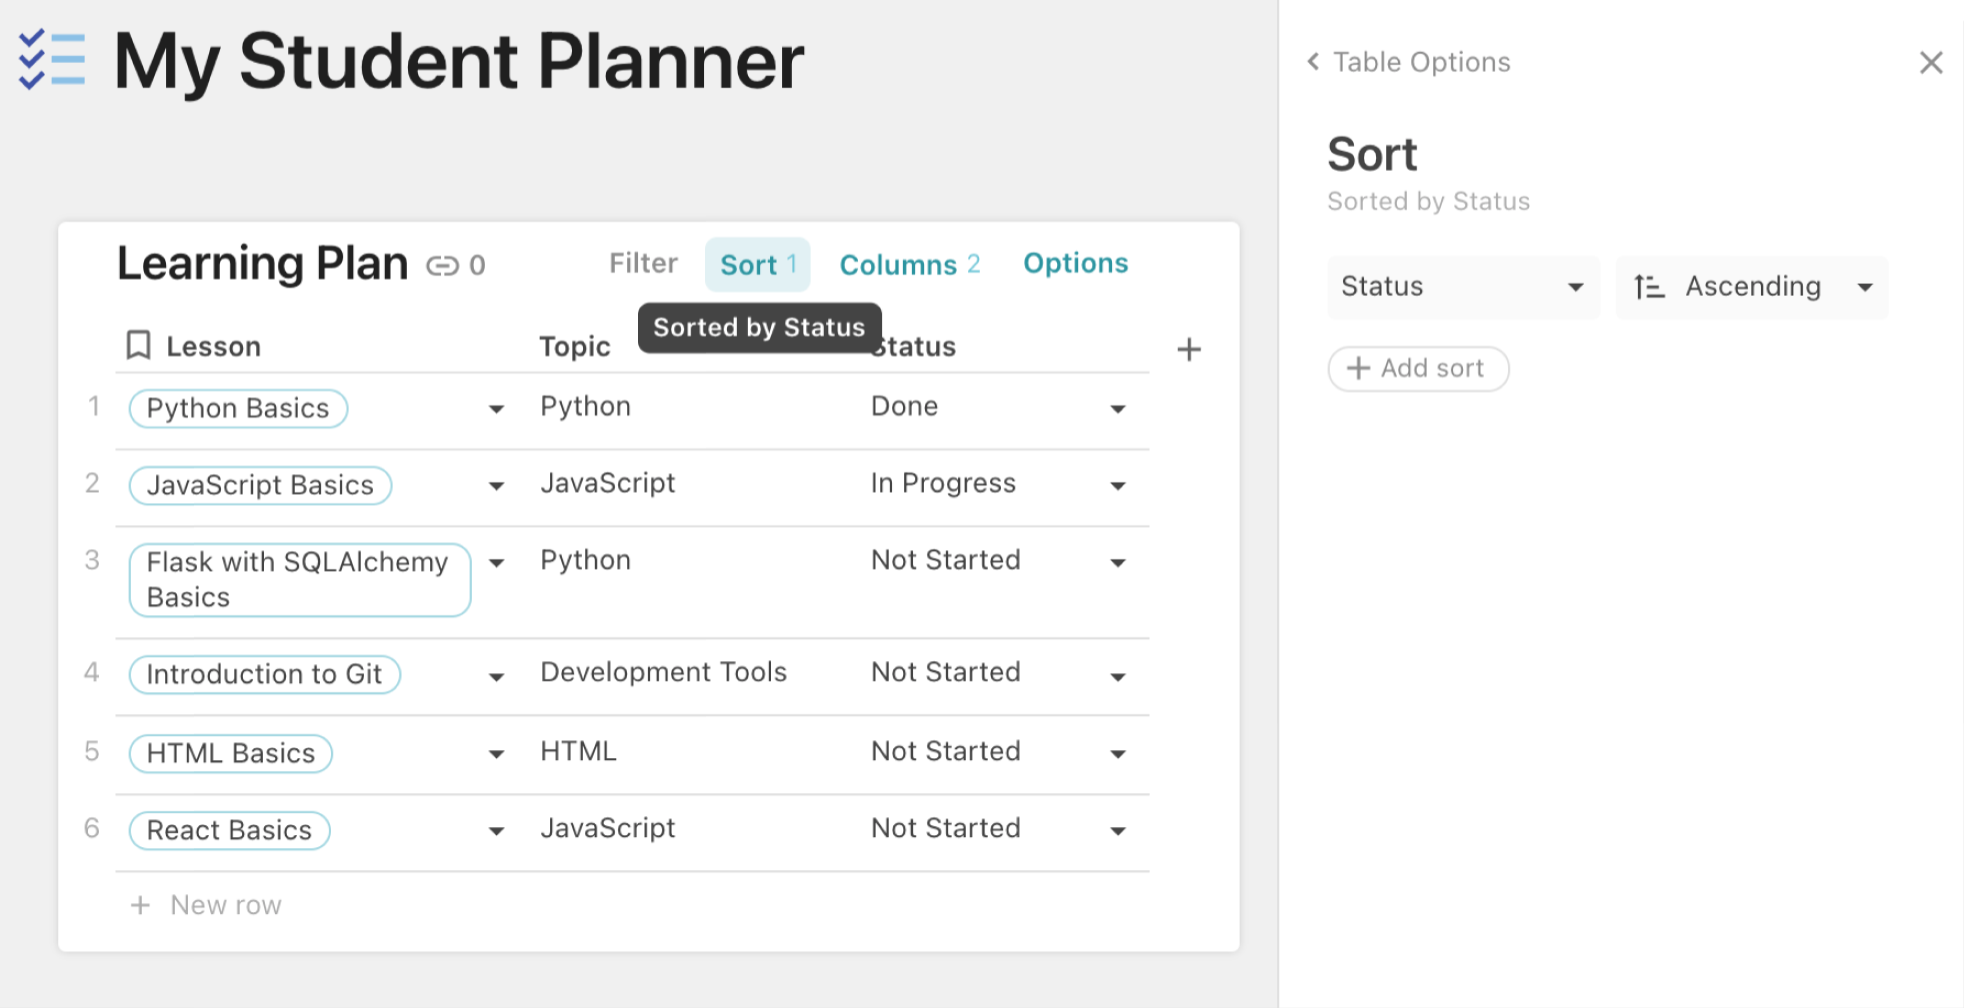
With Coda tables, you can easily sort data. For example, the "Learning Plan" table sorts lessons according to the Status selected, in ascending order, from "Done" to "Not Started":
Resources
Related Discussions
Have questions about this video? Start a discussion with the community and Treehouse staff.
Sign upRelated Discussions
Have questions about this video? Start a discussion with the community and Treehouse staff.
Sign upSometimes when you have a lot of information, 0:00 it's helpful to organize it into groups so it's easier to view. 0:03 You've learned how Coda tables structure and manage data like tasks, 0:07 learning goals, and more. 0:11 In the introducing Coda workshop, I gave you a quick preview of how to change table 0:13 views and display data in different ways. 0:17 In this video, we'll create a card view of our Learning Plan table and 0:20 group the cards by status. 0:25 First in the Learning Plan table, I'll click Sort, 0:27 then delete sort by Status – Ascending, so that I'm able to 0:31 rearrange my status groups in card view just for this example. 0:36 Now let's select, copy, and 0:41 paste the second view directly below our current Learning Plan table. 0:43 I'll select the entire table, then copy it using Cmd+C on Mac or Ctrl+C on Windows. 0:50 Then paste a new table below using Command+V on Mac or Ctrl+V on Windows. 0:58 Notice that this new table is called View of Learning Plan. 1:06 Now I'll click the table Options button, 1:12 then select Group and click the Add group button. 1:16 Then choose group by Status on the Left. 1:22 One of the most powerful aspects of Coda is the way it lets you look at 1:27 the same data in many different ways. 1:32 For example, a table can also be viewed with more details using the Detail view. 1:34 If you have numbers or dates, you can view the table as a chart, 1:41 timeline or calendar. 1:45 Think of a view of a table as a mirror of your data. 1:50 Any changes you make to one view is made in the other, so 1:53 you don't have to make changes to each table. 1:56 So let's change our View of Learning Plan table and 1:59 display it as cards in card view. 2:02 Here in the table options, select Cards. Leaving the table options sidebar open, 2:05 select Group, then change Left orientation to Top so 2:12 the Status column header is displayed on the top. 2:17 I'll scroll up and reselect Done in the status drop down so 2:23 that it displays in my View of Learning Plan table. 2:28 Then rearrange my groups so that Not Started is on the left, 2:36 then In Progress, then Done. 2:40 And then I'll go to the options menu to the right of each column header and 2:42 select "Pin this group" so that these groupings are always displayed, 2:48 even if no cards appear in a particular status column. 2:54 Now let's select a card or two and drag and 3:03 drop them between the different groups. 3:06 This for example is how you might track your learning progress. 3:10 Once you've completed a lesson, drag it to the next status. 3:13 Notice how any changes you make to view of learning 3:18 plan are made in the Learning Plan table, neat. 3:23 What makes Coda even more powerful are formulas you can add directly on 3:27 to any page outside of a table. 3:32 Let's add a quick summary at the top of the page of 3:35 how many lessons are "In Progress" and how many lessons are "Not Started". 3:38 First, type In Progress, then select it and 3:44 format it as an H3 Small Heading. 3:50 On the line below, I'll type Not Started and 3:55 format this as an H3 as well. 4:01 Then on the top line, I'll type an equals (=) sign. 4:08 This formula window that pops up is where we can tell Coda to pull information 4:13 from the Learning Plan table, filtering out only those rows where status 4:18 equals in progress and to give us a count of the number of instances. 4:23 To do that, in the Add formula text box, 4:28 I'll type Learning Plan.filter, 4:34 and in between the parentheses 4:40 I'll say Status = In Progress, 4:45 then outside of the parentheses, type .Count(). 4:50 That displays 2, because currently, 2 lessons are in progress, great. 4:58 I'll do the same for the not started summary, 5:05 type an equals sign, then in the Add formula text box, 5:10 type Learning Plan.filter Status = Not Started. 5:16 .Count(). 5:26 You can copy these formulas from the teacher's notes with this video. 5:28 And that displays 2, great. 5:33 Notice how Coda makes it easy to display dynamic values directly on the Canvas. 5:37 Each time the Status changes to Not Started in the table, the Not Started value changes at the top. 5:42 To learn more about about formulas, 5:49 go to the Coda resources section in your workbook. 5:51
You need to sign up for Treehouse in order to download course files.
Sign upYou need to sign up for Treehouse in order to set up Workspace
Sign up